This document was formerly published as GEX Doc. No. 100-209 Developing and Using Uncertainty Statements.
Overview
No measurement is perfect. When several measurements are made of the same quantity, different measured values may be obtained. The distribution of the measured values will differ depending on a number of factors related to personnel, measurement instrument and environmental factors that can affect the measurement response. These contributors can be expressed as an associated uncertainty. Knowing the magnitude of uncertainty associated with a measurement is crucial to making good decisions based on the measurement.
For example, when processing parameters are set to deliver an estimated dose to product of 20 kGy, dosimeters monitoring the process will give various readings, some above and some below 20 kilogray. Knowing the associated uncertainty of the dosimeter readings provides confidence that the specified dose is met or that the processing parameters are set to consistently provide dosimeter readings above 20 kilogray. If a measured value of 20 kilogray provides 95% confidence that the delivered dose is between 19 and 21 kilogray, the processing parameters can be increased by a factor of 20/19 or by 5.5% to ensure that measured doses are consistently above 20 kilogray. If the dosimetry system only provides 95% confidence that the dose is between 15 and 25 kilogray, the processing parameters need to be increased by 20/15 or by 33%. Most dosimetry users typically express their expanded dose measurement uncertainties at a coverage factor of k=2 or a confidence level of approximately 95 percent.
Most people are familiar with the concepts of precision (the variability of repeated measurements) and bias (the systematic difference of measurements from a true value) in measuring systems. These concepts work well with a single measuring system but are difficult to apply when working with multiple systems, some of which are not amenable to experimental manipulation. To address this difficulty, new methods of describing uncertainty were presented in the ISO guidance document Guide to Uncertainty in Measurement. The new descriptions of uncertainty differ by the approach used and are classified as either Type A or Type B. Type A uncertainty is estimated using statistical methods, which may include traditional precision and bias measurements. Type B uncertainty is estimated by other methods, which may include estimates from published reports, manufacturer specification or personal experience. The ISO method estimates expanded uncertainty as a combination of Type A and Type B estimates.
The individual routine dosimetry system user should be capable of performing and using the Type A measurements made at their facility and have sufficient knowledge to apply and add appropriate Type B uncertainty based on published information or data derived by outside sources to establish an expanded measurement uncertainty.
There are a number of documents that address measurement uncertainty and provide guidance. The terms, “overall uncertainty and “expanded uncertainty” can be used interchangeably to describe the combined total uncertainty of a measurement at a particular confidence interval. See ISO/PRF Guide 99998 Guide to the Expression of Uncertainty in Measurement (GUM) and ISO/ASTM 51707 Guide to Measuring Uncertainties in Dosimetry for Radiation Processing for information.
There are practical applications and benefits gained from the determination and application of “expanded” dose uncertainty. Uncertainty values can be used to provide:
-
Criteria used in Quality Control Charts to monitor processing results against specified limits,
-
Statistical basis for establishing timer settings for target doses with an appropriate level of confidence that the minimum dose is achieved,
-
Rationale for calibration verification testing to determine pass/fail criteria
-
Used to set an uncertainty budget for performance expectation of future batch calibrations.
-
Used as acceptance criteria for future dosimeter stock shipments of the same batch
The preparation of an uncertainty statement is not as complicated as it may appear. The documentation of the expanded uncertainty is typically prepared only once for a particular calibration and updated only if changes are needed due to a calibration audit failure, equipment change, etc.
The Appendix in this document provides an easy-to-read overview that may be useful in gaining an understanding of the process. The Appendix reviews two common approaches that identify 20 typical individual components of uncertainty that contribute to overall dose uncertainty.
GEX uses the “Top Down” approach described in the Appendix for estimating uncertainty because of its simplicity and direct line of traceability to the dosimeter batch calibration itself. An example of a “Top Down” Uncertainty Estimate is also provided in the Appendix.
GEX provides customers with dose measurement uncertainty calculations as a part of its standard Dosimeter Batch Calibration Service Package (GEX Part# S1101) using the aggregate Type A component derived directly from the customer’s specific in-situ calibration along with inclusion of appropriate estimated Type B uncertainty components to arrive at an “expanded uncertainty” that can be expressed with an appropriate coverage factor.
This approach also provides a statistically based means of determining pass/fail criteria for calibration verification audits. Contact GEX with questions or to receive instruction on how to include uncertainty statements with your calibration.
APPENDIX: Estimating Uncertainty
Commercial statistical software can be adopted and used to evaluate dosimetry data and access uncertainty. GEX incorporates the use of the Terastat, Inc. Calibrate software product that uses MS Excel statistical functions with worksheet templates developed specifically for use in radiation dosimetry. The Calibrate software performs calibration curve fitting and curve fit analysis functions and also provides assistance in identifying and organizing information about the uncertainty of dose estimates made using dosimetry.
An uncertainty statement should accompany any report of dose in order to add meaning to the dose measurement. Information regarding use of uncertainties is provided in documents such as:
-
ISO/PRF Guide 99998: 1993 Guide to the Expression of Uncertainty in Measurement (GUM) (https://www.iso.org/)
-
ISO/ASTM 51707 Guide for Estimating Uncertainties in Dosimetry for Radiation Processing (https://www.astm.org )
-
NPL CIRM Report 29 Guidelines for the Calibration of Dosimeters for use in Radiation Processing
-
ISO/IEC 17025:1999. General Requirements for the Competence of Calibration and Testing Laboratories. (https://www.iso.org/ )
-
Other publications are readily available to aid in understanding and applying measurement uncertainties
Purpose
-
Avoid surprises: Ideally the same set points on a process should yield the same dose measurement. In practice this does not occur. An uncertainty analysis provides the user with the ability to calculate the range of measured dose values that may be expected around a target dose during normal operations.
-
Identify nonconformities: If a dose measurement is outside the range of values expected during normal operation, it may indicate that some aspect of the process has failed. The out of expected range dosimeter measurement signals the need for further investigation.
-
Identify failure modes: An uncertainty analysis can identify the components of uncertainty that have the greatest impact on dose measurement. An increase in the uncertainty of a major component may be unacceptable; but a similar increase in a minor component may be acceptable.
-
Improve efficiency: An uncertainty analysis enables the operational set points of the radiation process to be set to optimize processing time.
Overview
An uncertainty analysis is typically performed when a measurement process is first established. As the measurement process changes, the uncertainty analysis is updated. Therefore, a new uncertainty statement is developed for each new dosimeter batch calibration or for any adjustment made to an existing calibration. An uncertainty analysis is also performed for each specific curve fit if more than one is utilized.
An uncertainty analysis has the following steps:
-
Specify the measurand: For radiation processing this is the dose delivered to the volume of space occupied by the dosimeter. This may differ from the dose delivered to products or other volumes of space. The relationship between the dose (measurand) and various input quantities (e.g. optical density, dosimeter thickness, standard traceable dose, temperature, humidity, etc) should be written as an equation to the extent possible.
-
Identify the Uncertainty Sources: List the sources of uncertainty. This includes all the effects that contribute to the calculation of the measurand. A general method of organizing the uncertainties is to use a cause and effect diagram. This diagram allows the uncertainties to be organized in a tree-like diagram that allows easy visualization of the relationships among sources of uncertainty.
-
Quantify uncertainty components: Measure or estimate the size of the uncertainty components. Directly measured (through experiment) sources are Type A uncertainties while estimated sources are Type B uncertainties. Both Type A and Type B uncertainties are expressed in standard deviation units.
It is often possible to identify a single contribution to uncertainty associated with several sources. This reduces the number of experiments or estimates required to develop an overall (expanded) uncertainty.
-
Calculate combined uncertainty
The uncertainty components are combined in quadrature (square root of the sum of squares) to estimate the total uncertainty. This summation assumes that the sources of uncertainty are independent (uncorrelated).
Uncertainty Design
Like almost all statistical processes, the design of the measurement process is as important as the measurements. Uncertainties can be estimated using statistical (experimental) methods or by other methods such as reviewing technical literature or using personal experience. In any case, the uncertainty estimate obtained will incorporate many other sources at a finer resolution.
There are two approaches to designing a process to estimate uncertainty. The first approach (“top down”) attempts to capture as many sources of uncertainty as possible in one experiment such as the dosimeter batch calibration. From this experiment is obtained one estimate of uncertainty that incorporates much of the expanded uncertainty of the system.
The advantage of the top down method is that it directly measures uncertainty as a Type A measurement and includes many of the sources of uncertainty in a single aggregate measurement. A disadvantage is that if the uncertainty obtained is larger than desired or budgeted, there is no indication as to which components are responsible.
The second approach (“bottom up”) attempts to estimate many separate sources of uncertainty and then combines them mathematically. More experiments are run with this method to capture the individual sources.
The advantage of the bottom up method is that the relative magnitude of each source is easier to segregate. Efforts can be focused on reducing the uncertainty contributions from the major contributors. The disadvantage of the approach is that it takes more effort and risks double counting. It is difficult to isolate a single component and small aggregates may contain the same components or omit one or more sources of uncertainty.
The sources of uncertainty can be organized using a cause and effect diagram. Below is a sample cause and effect diagram. This diagram shows some of the potential sources typical to many common dosimetry systems.
The diagram (Figure 1) is color coded as to the units of the uncertainties. The green sources affect dosimeter response and are in units (for radiochromic dosimeters) of specific absorbance. The blue sources affect baseline dose and are in units of dose. The calibration response function translates between dose and specific absorbance. The response function uncertainty is colored yellow. It could be in either units, but the uncertainty is usually obtained from the inverse of the response function and is therefore in units of dose.
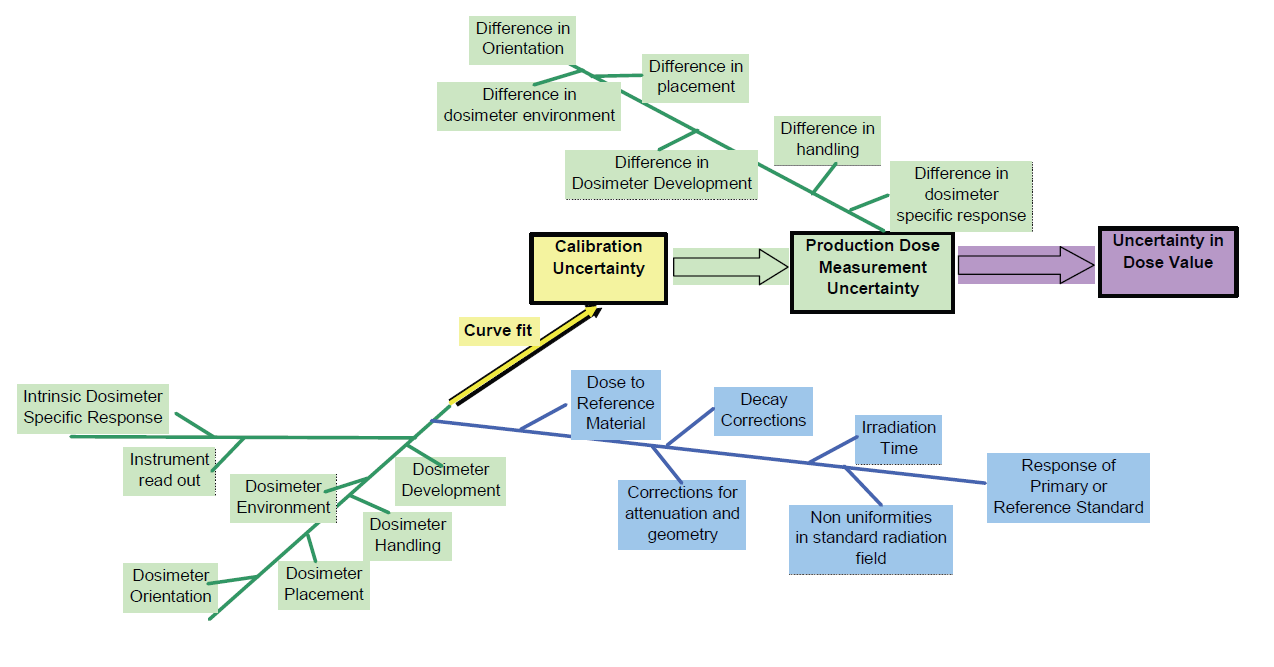
The diagram is useful for documenting the model of uncertainty and identifying redundancies. The above diagram depicts a design approach for a calibration performed using a laboratory calibration source. Significant differences will likely exist between the actual processing conditions of the production irradiator that must be taken into account by performing a minimum 3 point in-situ audit of the lab calibration in order to verify that the calibration response function is appropriate for use in the production irradiator.
The diagram for an in-situ calibration performed in the production irradiator under normal process conditions would also capture the “Production Dose Measurement Uncertainty” shown above in the “Calibration Uncertainty”. The in-situ calibration approach can therefore capture most of the “Uncertainty in Dose Value” needed for a complete expanded statement of uncertainty. However, a single in-situ calibration exercise cannot include seasonal environmental or time variations and instrumentation wear and tear that affect dose. These can be added as a Type B component along with any other uncertainty components that could also impact dose measurement results.
Bottom Up Approach
Bottom Up Uncertainties Listing
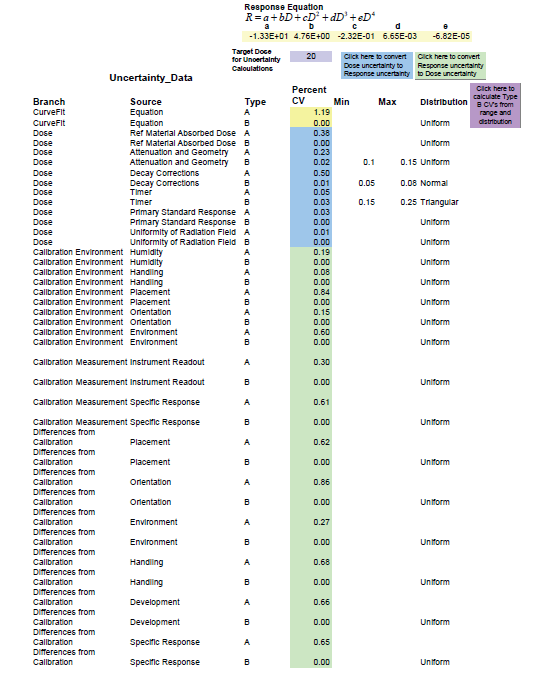
An uncertainties list worksheet shown below can be used to enter uncertainty values. The list is organized hierarchically, labeling each uncertainty with its path, branch, and source. These labels are used to summarize uncertainties and identify those uncertainties that are in response units and those that are in dose units. The uncertainty entries are in relative standard deviation units or percent coefficient of variation (percent CV). The entries are color coded, blue for dose units, green for response units, and yellow for curve fit (dose) units.
While type A uncertainties are found from experiment and are readily available, type B uncertainties come from other sources such as technical literature and personal observations and experience. These uncertainties are seldom provided in standard deviation units. However, a range for the uncertainty can usually be estimated, and a distribution selected. An uncertainty calculator is built into GEX’s Calibrate software for calculating the type B uncertainties as shown in the example below - Figure 2.
Top-Down Approach
Top Down In-Situ Calibration Uncertainty List
The in-situ calibration method provides an opportunity to use, a “top-down” approach to calculating uncertainty. In-situ calibration uses the production irradiation facility and high quality reference transfer dosimeters to capture much of the variability contributed by dose rates, temperature profiles and other process components.
An in-situ dosimeter batch calibration experiment can be designed that uses the routine process methods and practices such that the calibration itself captures a number of dosimetry uncertainty components in a single Type A aggregate uncertainty:
-
dosimeter shipment and storage conditions variance
-
pre-irradiation dosimeter placement and handling variance
-
process irradiator timer or speed control variance
-
process irradiation differences at the various calibration doses
-
process temperature differences at the various calibration doses
-
post irradiation recovery handling (including heat treatment)
-
post irradiation dosimeter signal response variance
-
measurement instruments and dosimetry holder variance
-
dosimeter thickness or mass variance
-
dosimeter environmental packaging variance
-
operator variance in use of measurement practices and Standard Operating Procedures
-
variance in calibration laboratory reported doses
-
reference transfer standard response differences from laboratory to field irradiation conditions
-
curve fitting
In addition to this single aggregate Type A uncertainty obtained from the insitu calibration, one needs to estimate and combine those additional uncertainty components not captured in the calibration exercise as Type B uncertainties:
-
seasonal environmental effects
-
dosimeter shelf-life or time/aging variance
-
routine dosimeter calibration versus production differences, if any
-
reference transfer dosimeters systematic error (Type B)
-
post irradiation dosimeter response change (if not included in the Type A aggregate)
-
other Type B uncertainty components not identified above.
Assessing and Estimating “Top Down” Type B Uncertainties
The ability to accurately estimate the Type B uncertainty component contribution requires an understanding of the influence quantities of the dosimeter, its measurement instrumentation and the controlling SOPs. After the values of standard variance assigned to each Type B component is combined in quadrature, the resulting expanded uncertainty is generally expressed for a coverage factor or k=2 or an approximate 95% confidence interval.
If the assigned Type B uncertainty values are appropriate, the user should be able to expect to use their expanded uncertainty value successfully in future calibration verification audits. In a perfect world a user would derive the same uncertainty value using either the “Top Down” or “Bottom-Up” approach to estimate uncertainty.
Using Multiple Instruments with a Single Calibration Curve
Multiple instrument data set values can be combined to provide a single calibration response curve provided the instrument data sets are sufficiently in agreement to support combination (typically ±1.0% or less). The resulting calibration captures the instrument variance in the large Type A in-situ aggregate calibration uncertainty component. Therefore, no additional consideration of a Type B uncertainty related to the use of multiple instruments should be necessary. Combining instruments in a single calibration assumes that the user can maintain all instruments within the performance limits that were captured in the dosimeter batch calibration.
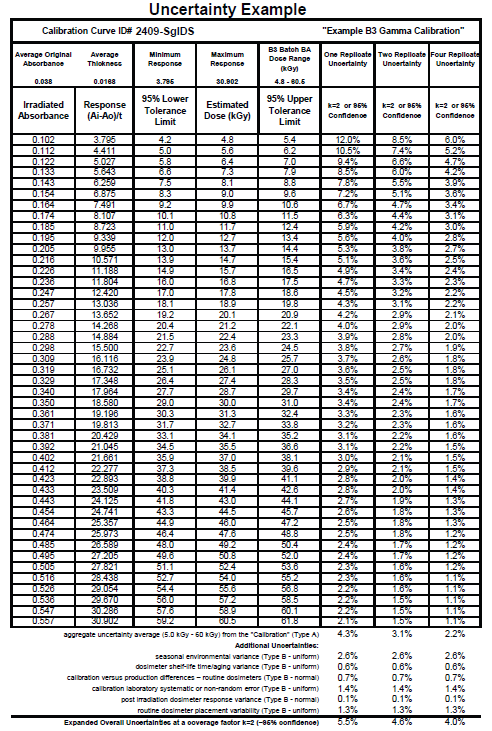
“Top Down” Uncertainty Estimation Example
An example of a “Top Down” Uncertainty estimate is provided below. This example uses a B3 Batch BA dosimeter in-situ gamma calibration Type A aggregate average dose uncertainty combined in quadrature with the GEX recommended Type B components for B3 radiochromic dosimeters shown in the Table 1 below.
|
Type B Uncertainty Component |
Source or Basis of Estimate for Use with GEX Pre-Packaged B3 WINdose and DoseStix Dosimeters |
Range Distribution |
Type B Uncertainty at k=1 and k=2 |
|---|---|---|---|
|
seasonal environmental effects |
Assumes the use of factory sealed dosimeter packages or equivalent covering a seasonal temperature variance range of 15°C. For example, process area or warehouse temperatures that can affect the dosimeter start temperatures can vary from 15°C to 30°C. Uses a temperature factor of 0.3 per degree C. |
4.5% “Uniform” |
1.30 & 2.60 |
|
dosimeter shelf-life response |
1.0% range with a “uniform” distribution is appropriate when the storage and handling temperatures are maintained to 35°C or below. Elevated temperature storage temperatures require specific testing to establish an appropriate uncertainty component range. |
1.0% “Uniform” |
0.29 & 0.58 |
|
routine dosimeter calibration versus production differences, if any |
User process facility and in-situ calibration design specific. Typically a range of 1.0% with a “normal” distribution is achievable if the user can verify that routine processing temperatures are approximately equivalent to the calibration temperatures. |
1.0% “Normal” |
0.33 & 0.66 |
|
laboratory transfer dosimeters systematic error (Lab Type B) |
Calibration laboratory random statistical error is captured in the in-situ calibration but the systematic or non-random error is not and needs to be accounted for as a Type B. Most certified and national labs do not include appropriate levels of uncertainty estimates for temperature correction error or differences in irradiation conditions from the lab internal calibration and the actual in-situ calibration conditions. Therefore GEX recommends use of a 2.5% range for this Type B component with a “uniform” distribution. |
2.5% “Uniform” |
0.72 & 1.44 |
|
post irradiation response change |
Use 0.2% range with “normal” distribution when B3 dosimeters are post irradiation heat treated before measurement. Although considered a Type B if the GEX recommended range is used, a user can perform post irradiation variance analysis that can be used as a Type A if desired. The impact on the overall uncertainty would be negligible because the impact of this component is relatively insignificant for B3 dosimeters. |
0.2% “Normal” |
0.06 & 0.12 |
|
routine processing dosimeter placement |
May be either a Type A if established statistically during calibration process or Type B if estimated from personal experience. Gamma processing produces lower dose gradients than electron beam that reduces the impact of placement variance. However, some electron beam facilities utilize fixed position reference monitoring holders to achieve a low level of placement variance. GEX suggest the use of 4.0% range for this component with “uniform” distribution as a default unless placement variance is actually measured and statistically evaluated. |
4.0% “Uniform” |
0.67 & 1.34 |
Table 1 - Example of “Top Down” Uncertainty Estimation
If the Type B estimates being used are published with a range of values with a coverage factor then the appropriate standard deviation can be back calculated. If the Type B uncertainty component reference contains only a range value then the Type B uncertainty component will need to be converted to a standard deviation unit. Three commonly used distributions for the conversion are:
-
Uniform – any value is equally likely to occur – Sigma u = (Range/2) / √3
-
Triangular – central values more common – Sigma u = (Range/2 / √6
-
Normal – central values most common, large deviations rare – Sigma u = (Range/2) / 3
GEX recommends use of the Type B estimates shown in Table 1 above for B3 radiochromic film dosimeters based on its broad spectrum of radiation process experience for gamma and electron beam applications above 1.0 MeV. For lower energy electron beam applications, GEX should be contacted for other Type B uncertainty values that are more appropriate.
Disclaimer -The information contained in this document is provided “as is” and is not a substitute for the user’s professional judgement. It is provided as a convenience to those using products provided by GEX Corporation who have sufficient technical skills to evaluate and properly apply the information in this document. It is the responsibility of the user of this document to ensure that the information in this document, and the use of such information, is accurate, complete, applicable to the product, suitable for the user’s purposes, and in compliance with all laws and regulations. GEX Corporation believes the information provided in this document is accurate and reliable as of the time of writing, but it undertakes no obligation to update or correct this document. GEX Corporation may, but is not required to, make changes to this document at any time without notice. By using the information in this document, the user represents and warrants that he or she has the skills necessary to properly understand and apply this information and that he or she will comply with all applicable laws and regulations including, without limitation, those relating to medical devices, pharmaceutical products, or other applicable industries. The user assumes all risks associated with using this information and any results or output resulting from the application of this information to GEX Corporation’s products. The user agrees not to hold GEX Corporation liable for any errors or omissions contained within.